CI/CD Analytics
Pipeline success and duration charts (FREE)
- Introduced in GitLab 3.1.1 as Commit Stats, and later renamed to Pipeline Charts.
- Renamed to CI/CD Analytics in GitLab 12.8.
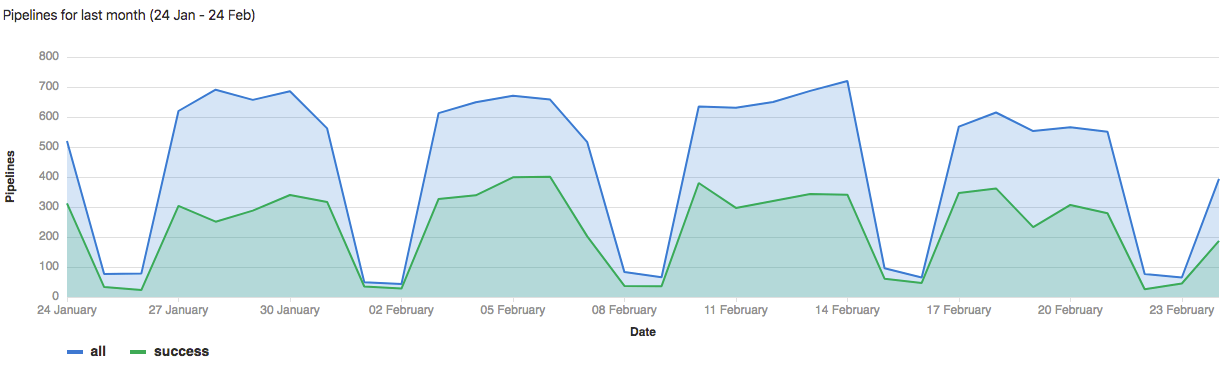
GitLab tracks the history of your pipeline successes and failures, as well as how long each pipeline ran. To view this information, go to Analytics > CI/CD Analytics.
View successful pipelines:
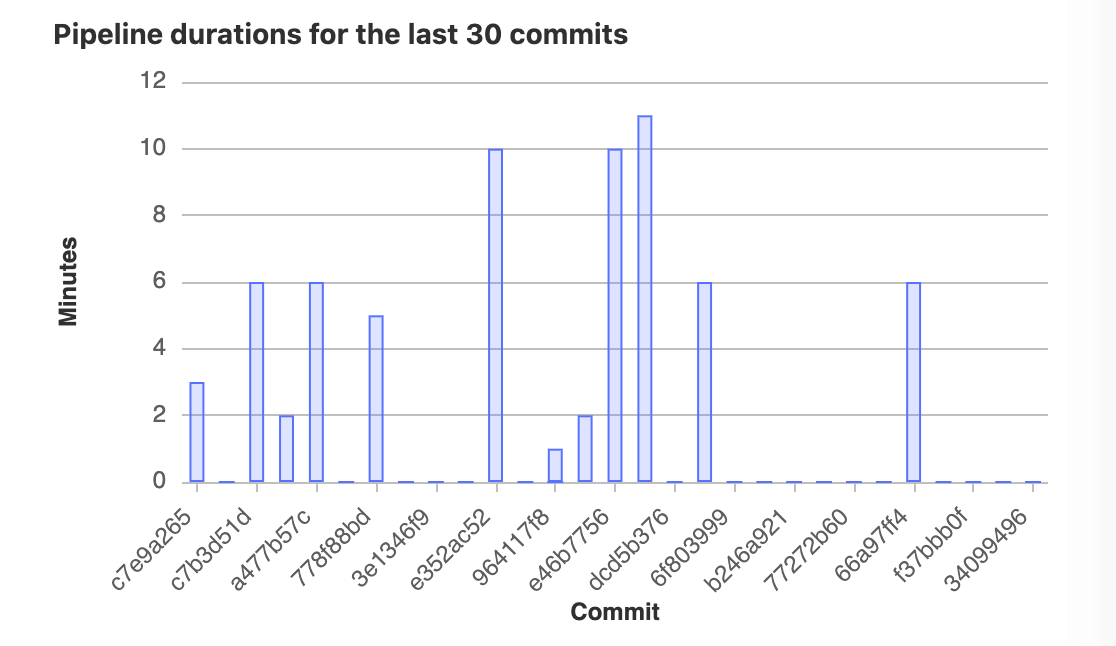
View pipeline duration history:
DevOps Research and Assessment (DORA) key metrics (ULTIMATE)
- Introduced in GitLab 13.7.
- Added support for lead time for changes in GitLab 13.10.
Customer experience is a key metric. Users want to measure platform stability and other post-deployment performance KPIs, and set targets for customer behavior, experience, and financial impact. Tracking and measuring these indicators solves an important pain point. Similarly, creating views that manage products, not projects or repositories, provides users with a more relevant data set. Since GitLab is a tool for the entire DevOps life-cycle, information from different workflows is integrated and can be used to measure the success of the teams.
The DevOps Research and Assessment (DORA) team developed four key metrics that the industry has widely adopted. You can use these metrics as performance indicators for software development teams:
- Deployment frequency: How often an organization successfully releases to production.
- Lead time for changes: The amount of time it takes for code to reach production.
- Change failure rate: The percentage of deployments that cause a failure in production.
- Time to restore service: How long it takes an organization to recover from a failure in production.
Supported metrics in GitLab
The following table shows the supported metrics, at which level they are supported, and which GitLab version (API and UI) they were introduced:
| Metric | Level | API version | Chart (UI) version | Comments |
|---|---|---|---|---|
deployment_frequency |
Project-level | 13.7+ | 13.8+ | The old API endpoint was deprecated in 13.10. |
deployment_frequency |
Group-level | 13.10+ | To be supported | |
lead_time_for_changes |
Project-level | 13.10+ | 13.11+ | Unit in seconds. Aggregation method is median. |
lead_time_for_changes |
Group-level | 13.10+ | To be supported | Unit in seconds. Aggregation method is median. |
change_failure_rate |
Project/Group-level | To be supported | To be supported | |
time_to_restore_service |
Project/Group-level | To be supported | To be supported |
Deployment frequency charts (ULTIMATE)
Introduced in GitLab 13.8.
The Analytics > CI/CD Analytics page shows information about the deployment
frequency to the production environment. The environment must be part of the
production deployment tier
for its deployment information to appear on the graphs.
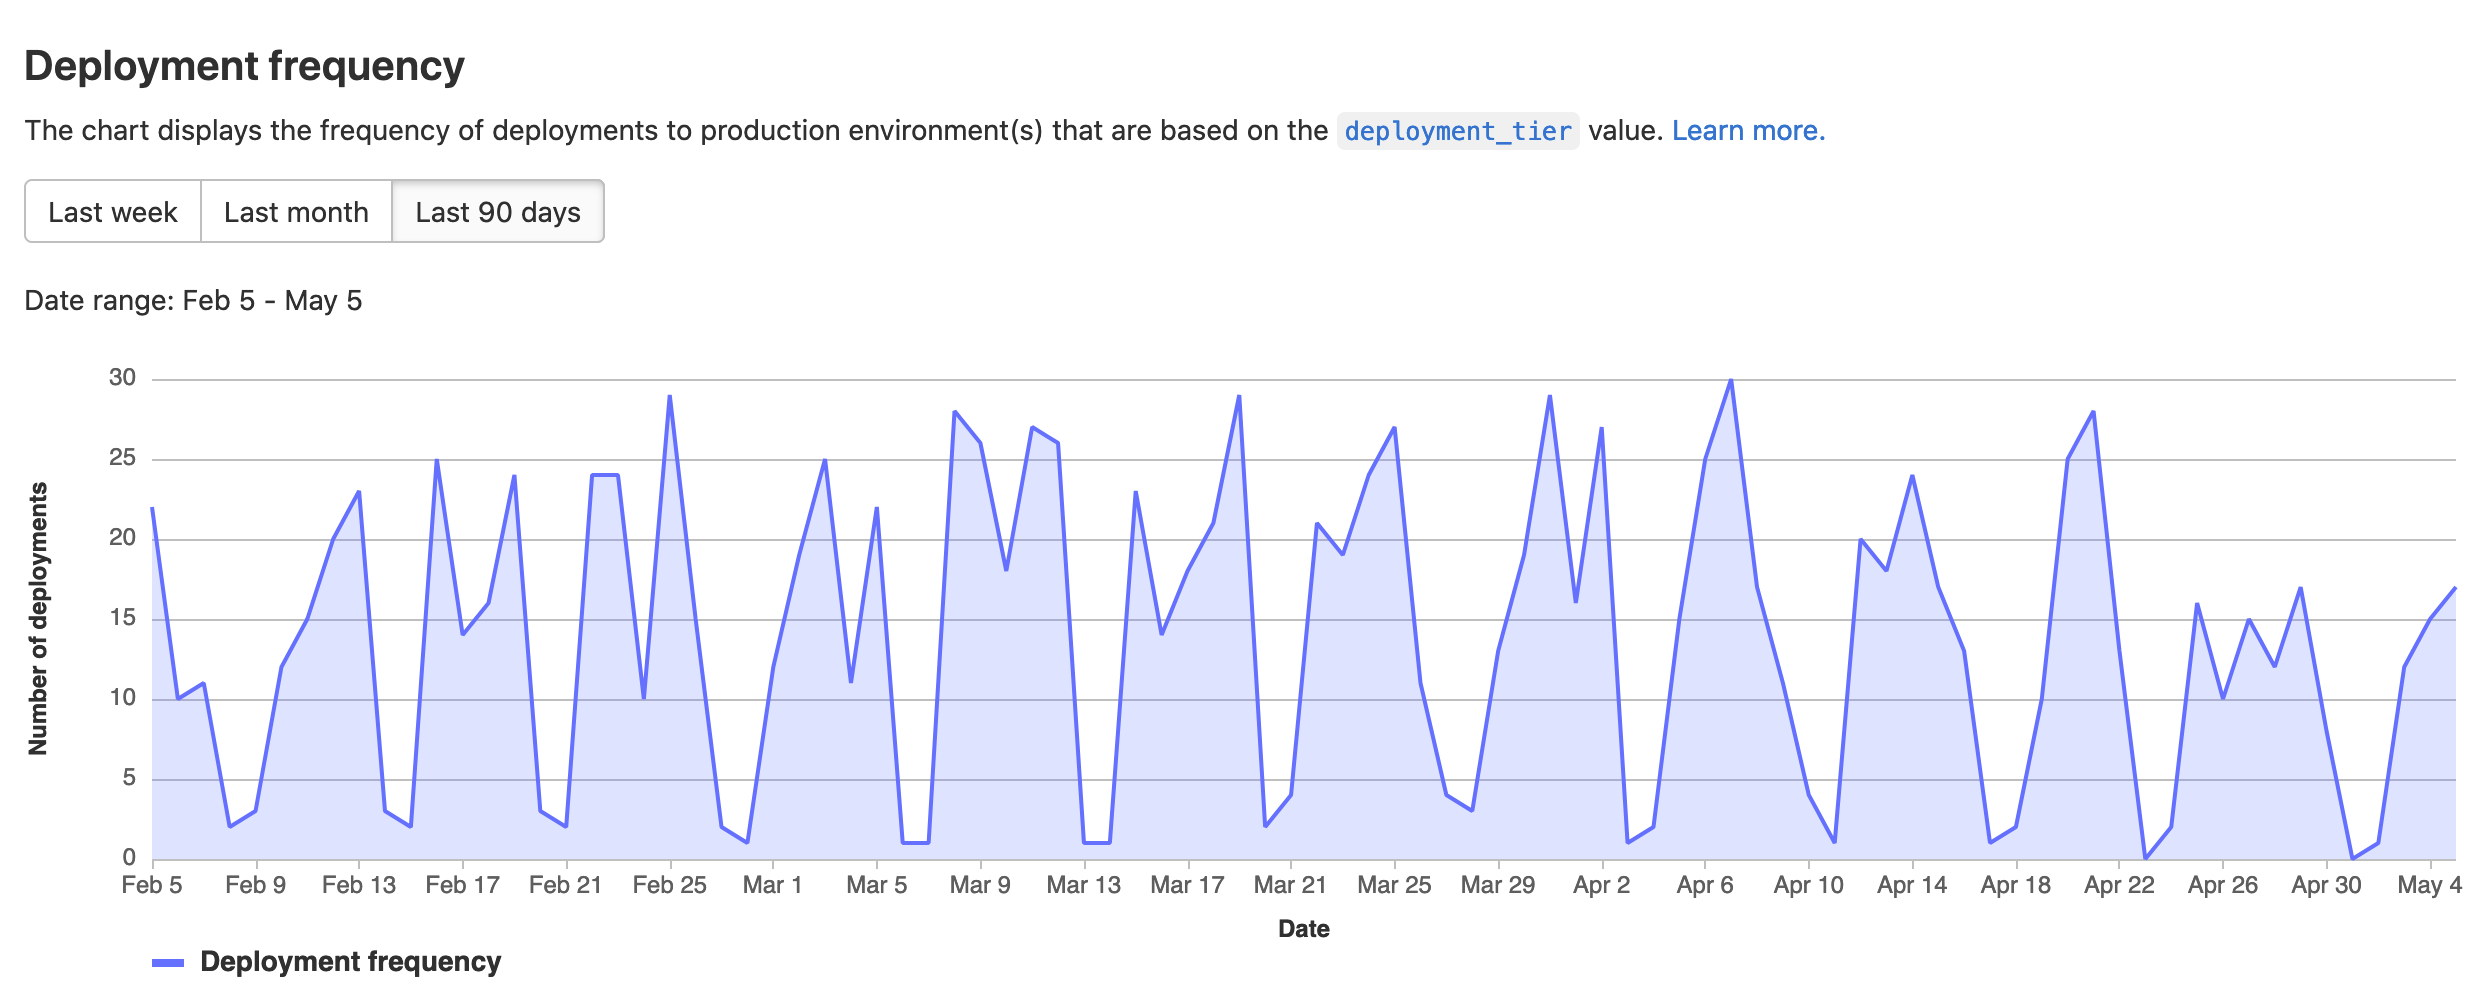
These charts are available for both groups and projects.
Lead time charts (ULTIMATE)
Introduced in GitLab 13.11.
The charts in the Lead Time tab show information about how long it takes merge requests to be deployed to a production environment.

Smaller values are better. Small lead times indicate fast, efficient deployment processes.
For time periods in which no merge requests were deployed, the charts render a red, dashed line.
These charts are only available for projects.